Linux is the operating system that has taken a special place among server operating systems today. Server and operating system management is very important to executable services. For this reason, Linux administrators generally use Linux software or commands to monitor server status. Attacks on Internet servers also make administrators pay much more attention to monitoring their servers. In this article, we try to introduce you to htop Monitoring System for Linux. You can visit the packages available in Eldernode to purchase a Linux VPS server.
Table of Contents
Htop Monitoring System for Linux
One of the needs that arises when working with any operating system is that the user can easily see the amount of use of system resources such as CPU and RAM. It can also view running processes.
Usually all existing operating systems provide this tool for users. For example, in Windows you can do this using a tool like task manager. This allows you to manage running processes and running applications. This is also possible in different Linux distributions. For example, you can manage hardware processes and resources in the ubuntu distribution using the system monitor tool.
The system monitor tool is not the only tool for managing processes. Some people who have a lot of experience working with Linux prefer to work more with text tools. These users tend to use tools that are terminal. Linux also has a solution for these users. These users can use the htop tool. Note that this tool may not be installed on your Linux by default. So you have to install it.
Htop is one of the best and most popular resource management software on the Linux operating system. If you are a little familiar with Linux, you are familiar with the top and ps systems for viewing ongoing processes. But htop may not be a familiar name to you. In this article, we will fully introduce this software to you.
What are the features of htop?

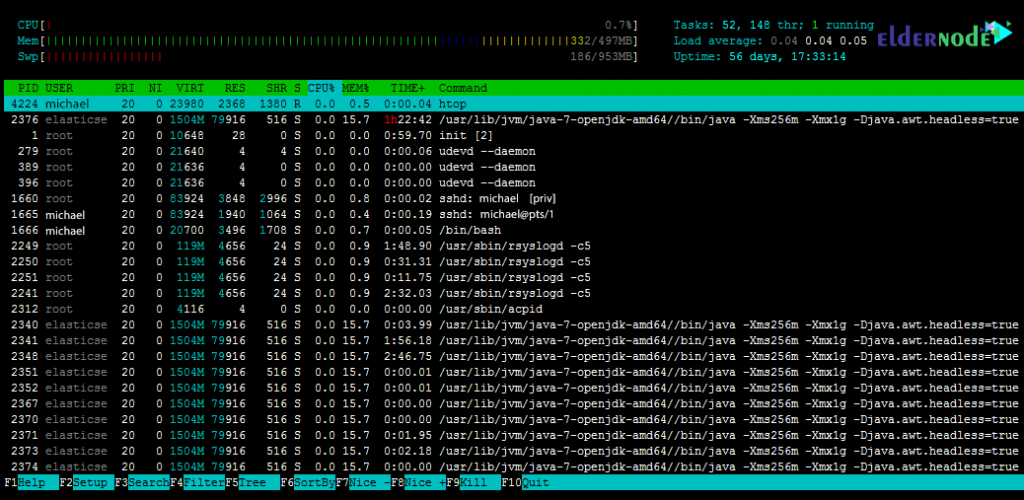
The htop tool has two sections on the main page. The top of the page shows the CPU, RAM, Swap usage of your system. The second section shows a list of processes that are currently running. It also shows the amount of resources used by each processor. For example, it shows how much RAM and CPU each processor uses.
One of the features of the htop tool is that you can work with the mouse as well. For example, if you click on any of the options at the bottom of the page, that command will run like a button. You can also sort processes based on CPU and RAM usage by clicking on existing headings such as cpu and memory. The point of this tool is that the main processing in this list is displayed in white and the rest of the child processing is displayed in green.
– In htop you can move vertically to see the complete list of steps and move horizontally to view the complete command lines.
– This program starts quickly because it can not wait to receive data.
– In htop you can kill more than one process without inserting your PIDs.
– In htop you do not need to enter the processing number or priority value to reprocess.
– You can press “e” to print a set of environment variables for a process.
– It is possible to use the mouse to select the list items.
What does htop monitoring do?
The htop monitoring system is a command line tool that allows you to control critical system resources or server processes in real time. In order to be able to get acquainted with htop performance, in the following, we will examine the htop items that show their performance. These sections include CPU, Memory, Load Average and Process Information.
CPU
As you can see at the top left of the screen, the percentage of usage is displayed in front of the cpu line. If a processor has a core, it is displayed with a line. But if a processor has multiple cores, the lines are displayed according to the number of cores. The lower the percentage, the lower the CPU load.
It should also be noted that in the above processes, red indicates the core process, green indicates normal usage trend, and blue indicates the low priority trend.
Memory
The next section shows the memory consumption by processes running on the server. In other words, it shows the amount of memory used of the total memory. It should be noted that the colors in front of this section are such that green indicates the memory pages used. Indicates blue, buffer pages, and yellow cache pages.
Load Average
Load Average is the average of the computational work done by the CPU. This parameter is located in front of the Mem section. It should be noted that the Load Average consists of three values. The first number is a minute average (0.04 in the image above), the second number is 5 minutes average (0.04) while the third number is fifteen minutes average (0.05).
Process Information
The other parameters that you see in the middle of the image above are related to information processing. These parameters include PID, USER, VIRT, %CPU, %MEM, COMMAND, which are briefly described below.
– PID: Represents the unique process identifier.
– USER: Is the owner of the process.
– VIRT: Represents the virtual memory used in the process.
– %CPU: This section shows the percentage of CPU time used by the process.
– %MEM: Shows the percentage of physical RAM used by the process.
– COMMAND: The COMAND section contains the name of the command that started the process.
Benefits of htop Monitoring System
1- Search between ongoing processes
2- Filtering processes
3- Ability to kill special processes
4- Moment-by-moment monitoring of server processing
5- Display CPU and RAM status
Conclusion
Htop is basically an interactive or semi-graphical environment of the top Linux command that you can enjoy by installing it. This command displays all your Linux processes after execution and you can kill them as you wish. In this article, we tried to fully acquaint you with htop Monitoring System for Linux.