An administrator spends his time, credit, money, and sometimes the best idea of his entire life, so, he has just one choice; to succeed! Observing the existence of a problem always helps us to be able to prevent or solve it. Undoubtedly, you need to monitor your system frequently. As a monitoring system, Icinga monitors your system to notify you if your network resources are still available or not. No IT administrator is happy with the word “outages” but they prefer to be the first one who detects it. It will be even more interesting if you read this article to the end, so join us with the Introducing Icinga 2 Linux Server Monitoring Tool. To prepare a perfect Linux VPS package, visit Eldernode and buy an economical VPS with a VIP supporting.
Table of Contents
Icinga 2 Linux Server Monitoring Tool
Icinga is an open-source computer system that was developed independently from Nagios in 2009 and became an original network monitoring application. Some of the changes were to add new features and database connectors. IDODB is the Icinga Data Out Database which is a storage point for historical monitoring data for add-ons or the Icinga web interface to access. Icinga supports MySQL, Oracle, and PostgreSQL. Icinga 2 is also written in C++ and is possible to be built on Linux and Windows and under the terms of the GNU License. Icinga 2 is ready to monitor your entire infrastructure and generate the results of your system’s data analyses to help you to have available and stable evidence. By collecting detailed data about your system functions you would be able to check it’s up and running and act fit your needs timely.
How Icinga 2 Monitors
In this part, we would review to see what way is chosen for monitoring by Icinga2, to be run with users. Icinga 2 is able to use different value types for attributes to present the correct necessary information which will cause a valid configuration. For example, to check the availability of your hosts and services, you need Icinga 2’s monitoring. Any time you can add a hosts and services to be monitored by Icinga 2. Have a look at some host and services which could be checked:
1- Monitoring of Network services (HTTP, SMTP, SNMP, SSH, etc.)
2- Monitoring of host resources (CPU load, disk usage, system load, or the number of users currently logged in, etc.)
3- Monitoring of server components (switches, routers, temperature and humidity sensors, etc.)
4- Monitoring of the down and unreachable hosts
5- Helps to develop service checks by designing a simple plug-in
6- Parallelized service checks
7- Ability to define event handlers to be run during service or host events for proactive problem resolution
8- Printers
Host And Service State
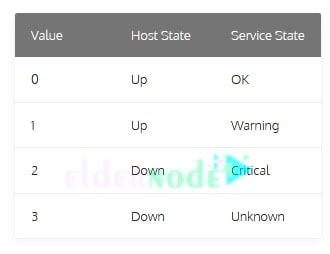
Hosts and services are monitoring objects. Icinga 2 sends you the status of your host using the words ”Up” or ”Down”. Clearly, while you are notified ”Up” you would understand the host is available.
Also to detect the status of your service, it uses the words ”Ok”, ”Warning”, ”Critical”, or “Unknown”.
To learn better the above explanations, look at the check result state map as an example. Plugins return with an exit code but they are converted into a state number to be readable. This map is showing the status of services and due to an agreement hosts will treat 0 or 1 as UP.
Do not be worry about receiving several notifications, Icinga 2 does not alert you once detecting a problem but starts to re-check the suspicious object to notify you just for a real threat, not a temporary issue. The SOFT state is the period of time that Icinga 2 detects an object, re-check it, and finds it is not necessary to be notified. But if re-checks results in a non-OK state, it switches the host/service to a HARD state and sends you a notification to start required actions.
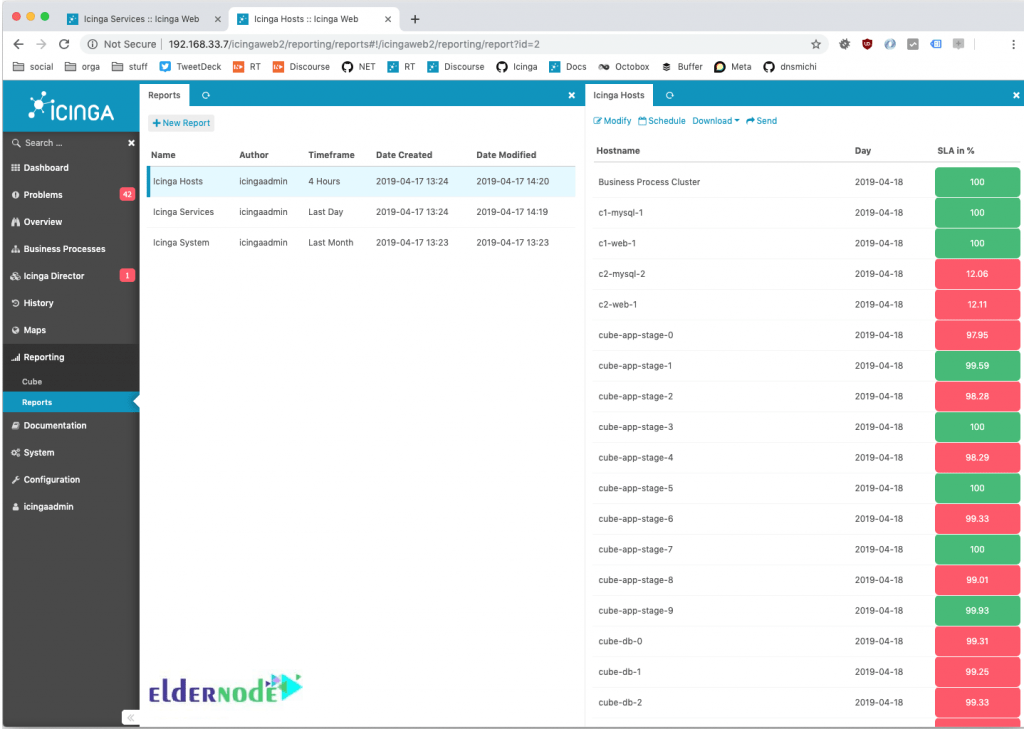
Reporting Process
In a network monitoring system, the reporting factor is significant. Icinga has designed a framework module. Opposite of public belief, no data is being collected, it just processes the data and sends them in PDF, JSON, or CSV formats or view them directly within the Icinga web interface. In case you prefer, you can receive the reports via email periodically.
Features Of Icinga 2
When you decide to use Icing 2, you would safely leave the monitoring management and running checks because Icinga2 does the tasks well to send you the necessary notifications. Also, there are some other benefits that you can see below:
1- Flexible and modular architecture
2- Dynamic web interface
3- Enterprise-Grade extensibility and authentication
4- 100% open-source and community-driven
5- Designed to make monitoring easier
Disadvantages of Icinga 2 Linux Server Monitoring
Among all flexibilities, it is not deniable that the configuration is arcane and has not designed for non-Unix people or beginners and they will face challenging situations and they wish if it could be simpler. On other hand, Icinga fans believe that if you read about it you do not feel the complexity of the first day’s installing anymore.
ICINGA VS NAGIOS
As you read earlier about the database, while Nagios supports MySQL, Icinga is also supporting PostgreSQL and Oracle databases in addition to MySQL. From point of addons, configurations, and plugins these two are not different and are compatible. But in comparing architecture and core and reporting capabilities or the two web interfaces and API context, Icinga is brilliant more.
Conclusion
In this article, you learned about the Introducing Icinga 2 Linux Server Monitoring Tool. If you need a perfect and simple but powerful network monitoring tool, it will be your favorite certainly. The word Icinga means “It browses” and “It examines” and really it worths browsing and examine it!