
ELK is a collection of open source applications. You can collect, analyze, visualize reports from a variety of sources, using ELK. It is consists of components called Elastcisearch, Logstash and Kibana, which in this article, you will get acquainted with their features and then you will learn How to Install Elastic Stack 7 on Debian 11. You can see the packages available in Eldernode website, if you want to purchase Linux VPS server.
Table of Contents
Tutorial Install Elastic Stack 7 on Debian 11
ELK Components
1–> Elasticsearch is a search and analysis engine.
2–> Logstash is a server-side data processing pipeline that receives, converts and then sends data from multiple resources at the same time.
3–> Kibana allows users to visualize data with charts and graphs in Elasticsearch.
4–> Beats collect reports from servers and send to Logstash or Elasticsearch.
In the continuation of this article from the Debian tutorials series, we will explain to you step by step how to Install Elastic Stack 7 on Debian 11 with its components.
Installing Elastic Stack 7 on Debian 11
First update your system packages using the following commands:
sudo apt-get updatesudo apt-get upgradesudo rebootYou need to install Java 8 or 11 before installing ELK. Run the following command to install OpenJDK 11:
sudo apt install openjdk-11-jdk -yYou can check on the version to confirm the Java installation:
java --versionThen use the following command to install Elastic stack PGP signing key:
wget -qO - https://artifacts.elastic.co/GPG-KEY-elasticsearch | sudo apt-key add -You can install ELK APT repository on Debian 11 with the following command:
sudo apt install apt-transport-httpsecho "deb https://artifacts.elastic.co/packages/7.x/apt stable main" | sudo tee /etc/apt/sources.list.d/elastic-7.x.listThen update the cache of package list using the following command:
sudo apt updateAfter successfully adding the ELK repository, you can install the various components of the Elastic stack.
How to Install Elasticsearch on Debian 11
To install Elasticsearch, first run the following command:
sudo apt install elasticsearchNow run the following command to configure Elasticsearch to define the IP address and port you want to listen on and set the discovery type and cluster name:
sudo vim /etc/elasticsearch/elasticsearch.ymlThen apply the following changes:
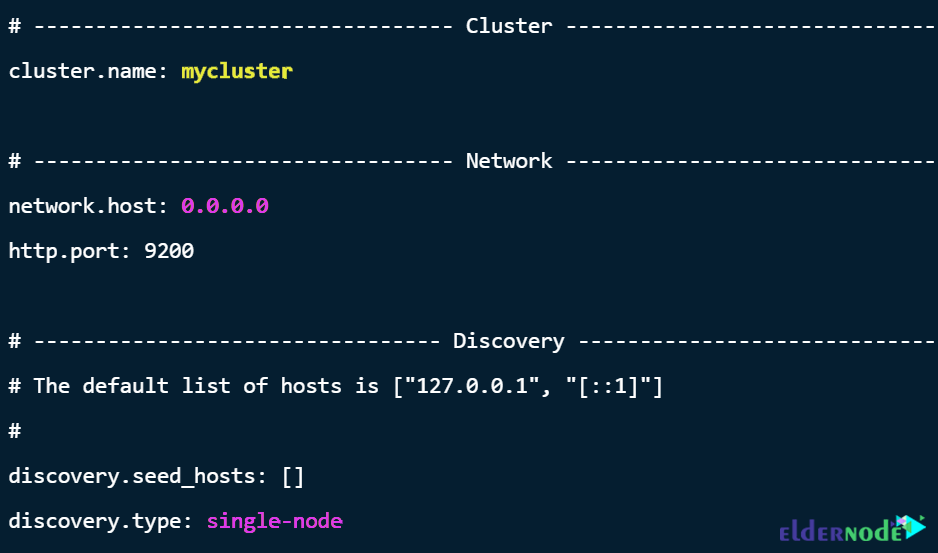
Adjust JVM heap size on the memory in your system using the following command:
sudo vim /etc/elasticsearch/jvm.options
Now save the file and run the following command to start and enable Elasticsearch:
sudo systemctl enable --now elasticsearchThen confirm status using the command below:
systemctl status elasticsearchHow to Install Kibana on Debian 11
Install the Kibana with the following command:
sudo apt install kibanaUse the following command to configure Kibana:
sudo vim /etc/kibana/kibana.yml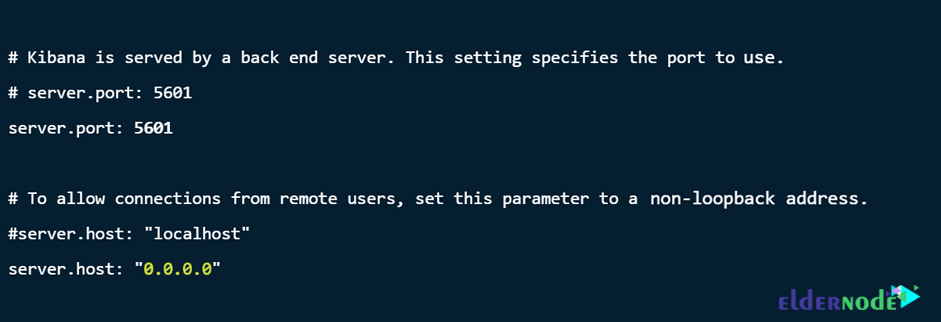
Apply the following settings to configure the Kibana connection to Elasticsearch:

Run the following command to enable and start Kibana:
sudo systemctl enable --now kibanaThen confirm Kibana status with the following command:
systemctl status kibanaRun the following command to configure the firewall, so the Kibana port will be accessible for Kibana from the internet:
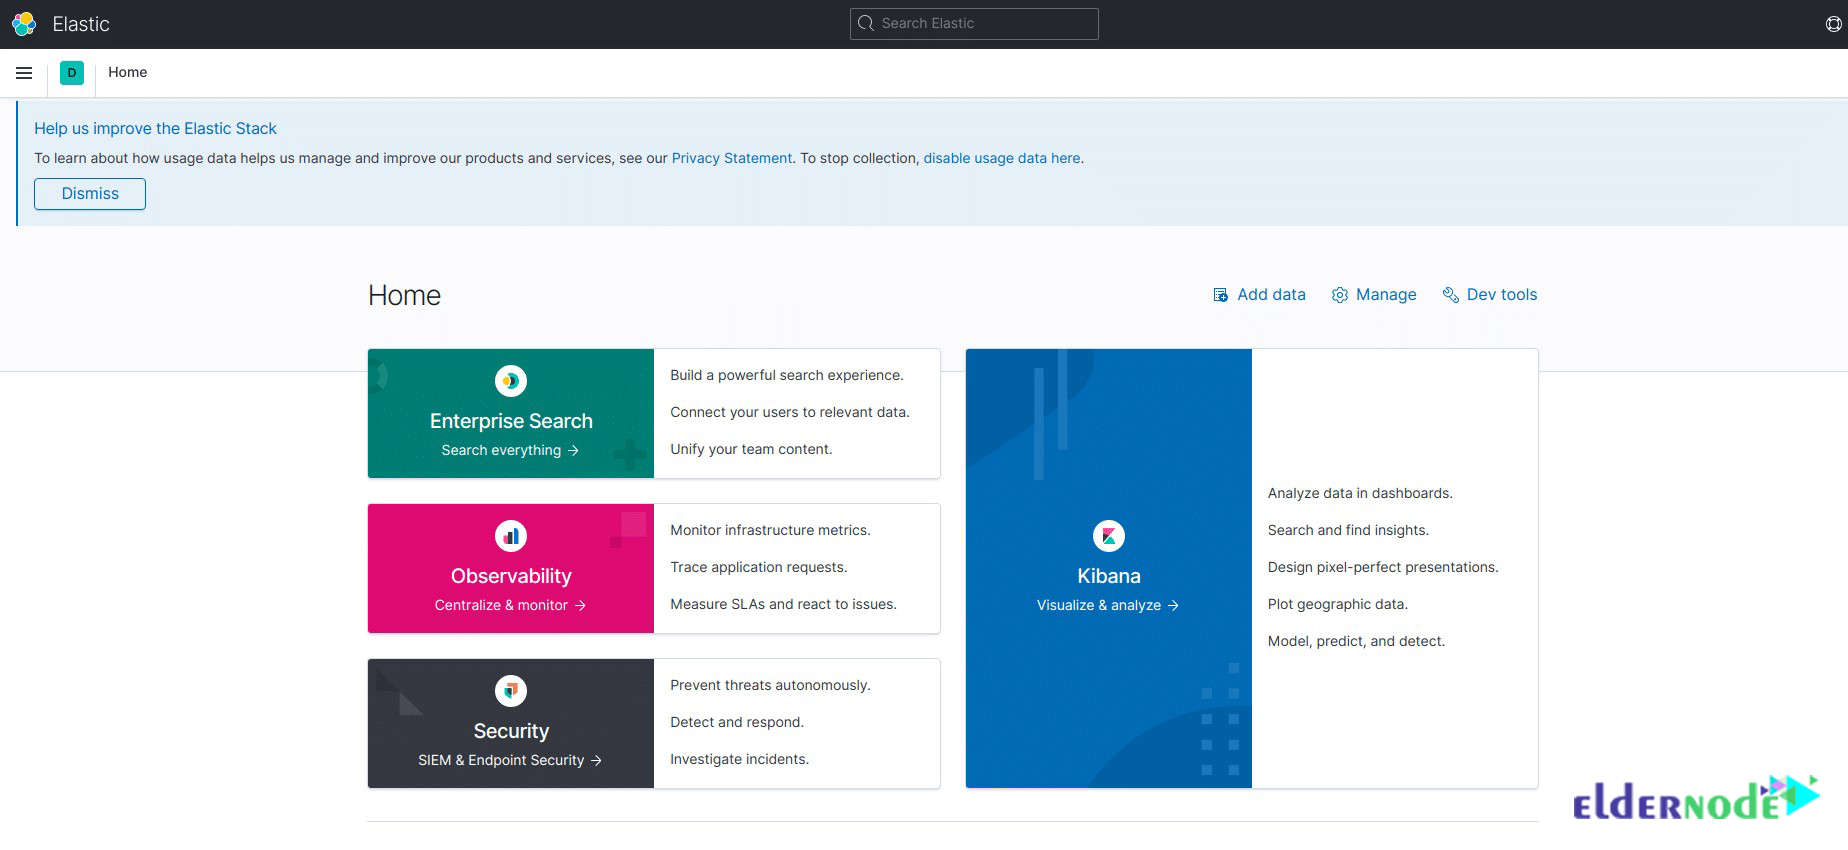
sudo ufw allow 5601/tcpYou can access the Kibana dashboard from the browser using the IP server or hostname and Kibana port: http://<server-ip-address>:5601
How to Install Logstash on Debian 11
You can install Logstash with the following command:
sudo apt-get install logstashTo configure Logstash, first create a file called 02-beats-input.conf, where you can configure your Filebeat input:
sudo vim /etc/logstash/conf.d/02-beats-input.confThen add the following content:
input { beats { port => 5044 } }Now you need to add filter settings to create system reports, so run the following command to create another configuration file:
sudo vim /etc/logstash/conf.d/10-syslog-filter.confModify the contents of the file in the following order:
filter { if [type] == "syslog" { grok { match => { "message" => "%{SYSLOGTIMESTAMP:syslog_timestamp} %{SYSLOGHOST:syslog_hostname} %{DATA:syslog_program}(?:\[%{POSINT:syslog_pid}\])?: %{GREEDYDATA:syslog_message}" } add_field => [ "received_at", "%{@timestamp}" ] add_field => [ "received_from", "%{host}" ] } syslog_pri { } date { match => [ "syslog_timestamp", "MMM d HH:mm:ss", "MMM dd HH:mm:ss" ] } } }Finally, create another configuration file to store beats data in Elasticsearch by Logstash:
sudo vim /etc/logstash/conf.d/30-elasticsearch-output.confAdd the following contents to the file:
output { elasticsearch { hosts => ["your_ip_address:9200"] manage_template => false index => "ssh_auth-%{+YYYY.MM}" } }Run the following commands to start and enable Logstash:
sudo systemctl start logstashsudo systemctl enable logstashHow to Install Filebeat on Debian 11
ELK uses beats to send data from various sources and submit it to Logstash or Elasticsearch. Filebeat is used to collect and send report files.
Run the following command to install Filebeat on the same server as Elasticsearch:
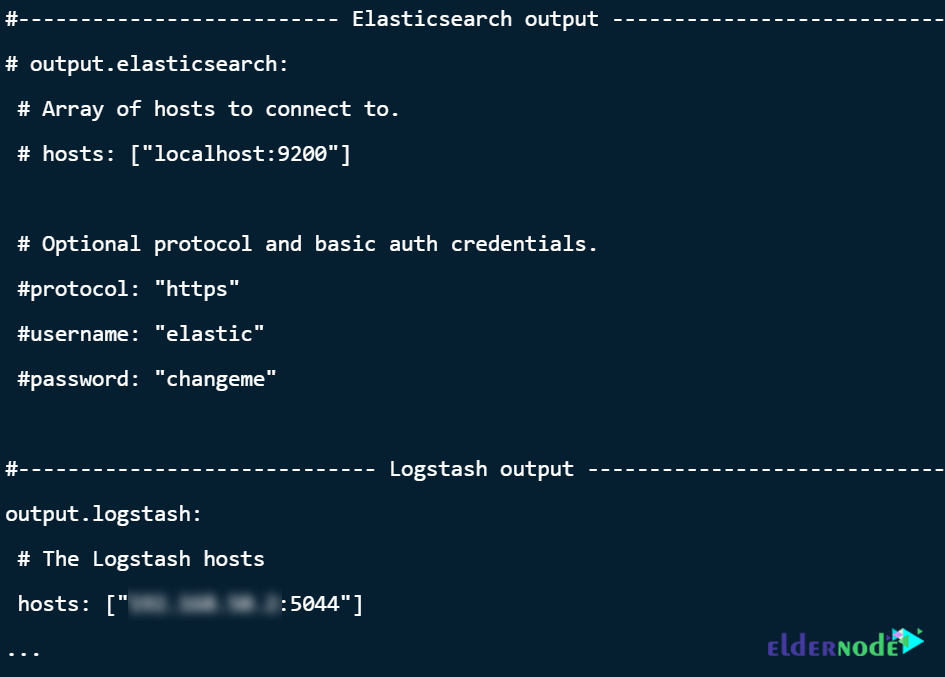
sudo apt-get install filebeatTo send data to Logstash, run the following command to configure Filebeat:
sudo vim /etc/filebeat/filebeat.ymlIn the output section, apply the following changes:
Enable Filebeat modules with the following command:
sudo filebeat modules enable systemThen run the following command to load index template:
sudo filebeat setup \--index-management -E output.logstash.enabled=false \-E 'output.elasticsearch.hosts=["IP.address:9200"]'Finally you can start and enable Filebeat with the following command:
sudo systemctl start filebeatsudo systemctl enable filebeatNow login to Kibana to add Filebeat index and follow the path below to add a new index:
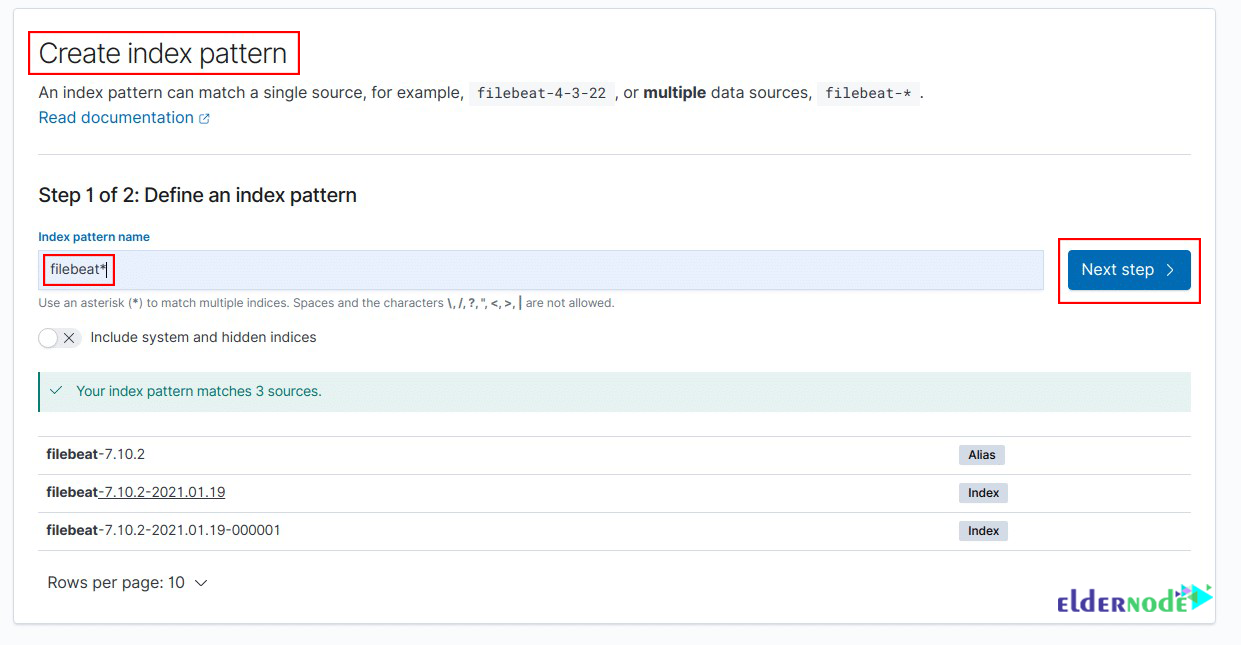
Management –> Stack Management –>Kibana –> Index Patterns –> Create Index Pattern
To search for matching patterns, enter filebeat in the index pattern name. After finding the patterns, click Next Step:
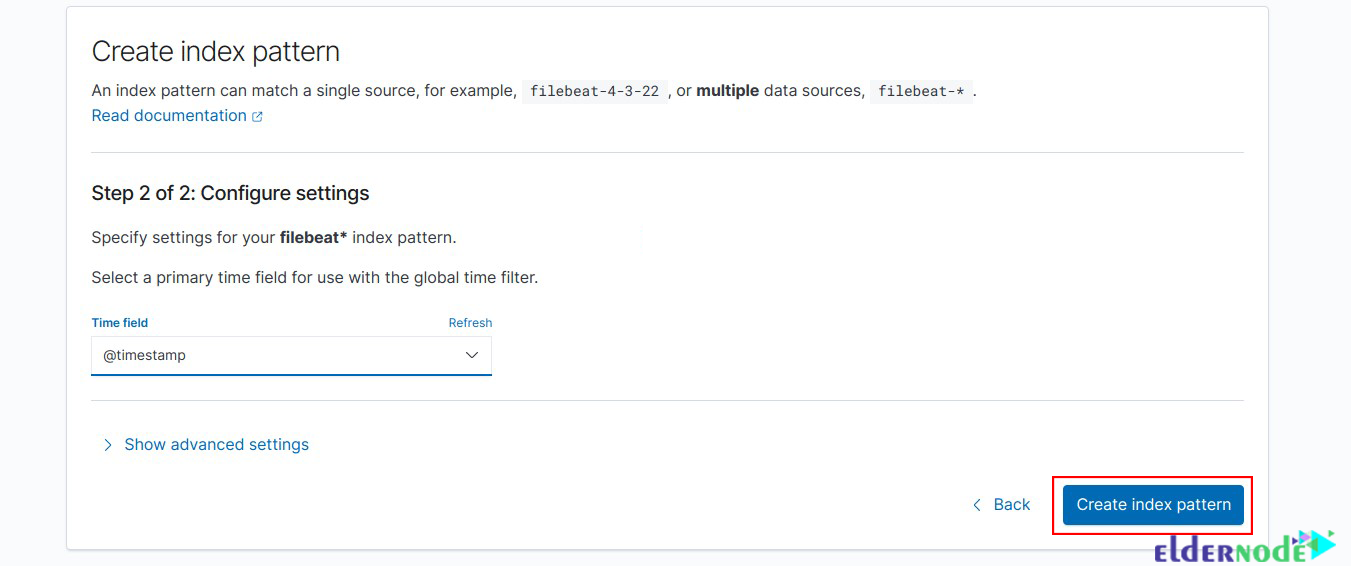
Then to configure new index, click on Create Index Pattern:
Finally from the previous menu, click Discover to display your data:

Conclusion
In this article, we introduced Elastic Stack, which is a collection of open-source applications, and examined the features of its components (Elasticsearch, Kibana, Logstash). You also learned How to Install Elastic Stack 7 on Debian 11 through this article.


![What is Pritunl? [Every things about Pritunl]](https://blog.eldernode.com/wp-content/uploads/2023/03/What-is-Pritunl-300x164.webp)

