
Graylog is an open-source and free log management tool that is used to collect, index, and analyze any server log from a centralized location. It is based on Java, Elasticsearch, and MongoDB. Using Graylog allows you to monitor SSH logins and unusual activity for debugging applications. In other words, when you work in a large environment, you face a vast amount of data. So, you need a powerful tool to help you monitor, search, and analyze your data into a simple format to let you read and digest it easily. This article is Introducing Graylog for Linux Logs Management. To purchase your own Linux VPS or find a suitable VPS package visit Eldernode and forget the rest.
Table of Contents
How To Manage Logs With Graylog Server On Linux(Centos, Ubuntu, Debian)
Graylog Server receives and processes messages from various inputs and provides a web interface for analysis and monitoring. The Graylog server is available for Linux distributions such as Debian Linux, Ubuntu Linux, or CentOS. To security log managing, Graylog collects, store, and correlate the network data that would detail all activity in your systems and networks. The activities include records produced by operating systems, applications, devices, and users. In the following, you will learn more about Graylog and the way it functions on Linux.
What is Graylog and How it works?
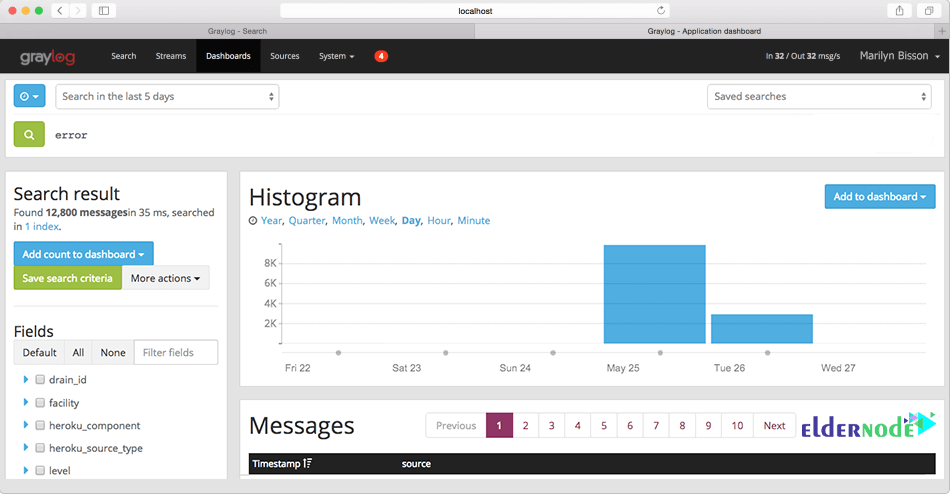
Graylog is currently available in three license types as Open-source, free enterprise, and commercial. As we mentioned, Graylog is based on Java, Elasticsearch, and MongoDB. Elasticsearch stores all the incoming messages and provides a searching facility. MongoDB is used for a database and stores the configurations and meta information. To combine, enrich, correlate, query, and visualize all your log data in one place you just need to start using Graylog and prepare answers to your team’s security, application, and IT infrastructure questions.
The full-screen Dashboard could display all the surrounding elements on your laptops, computers, and/or monitors on one screen.
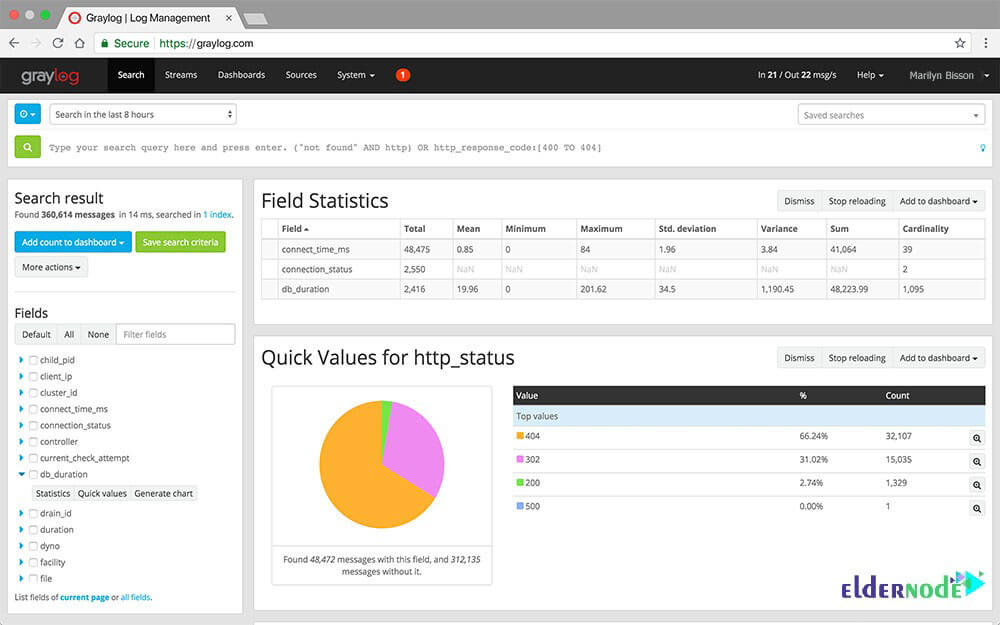
Analyzing every incoming log message in real-time is one of the Graylog advantages. So, the messages can be assigned to so-called streams. Using predefined criteria, it is checked which message is assigned to which stream.
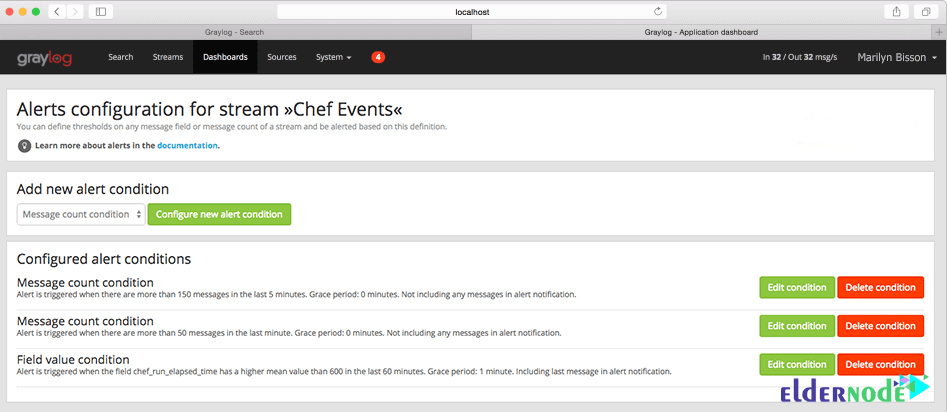
In this way, you will receive alerts if certain values are outside of defined parameters. The alerting options range from calling HTTP callbacks to sending messages by email to defined addresses. You can also check the status of a stream by monitoring solutions such as Nagios. It means that Graylog can be integrated into an existing monitoring environment.
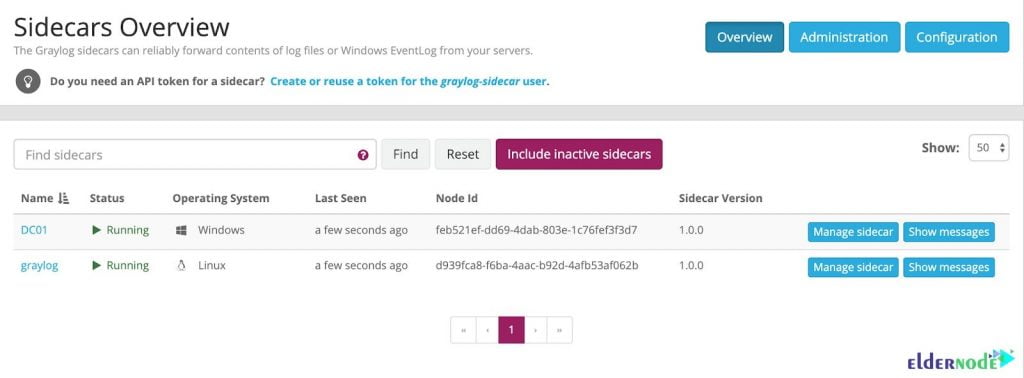
Graylog Sidecar
To help you gather logs from all your computer systems easier, you can use Graylog’s Sidecar. Graylog Sidecar allows for centralized and stackable configuration, utilizing any log collection agent. Also, it can control the agents in your environment while maintaining a consistent configuration across the hosts via a tag system.
Graylog Features (Introducing Graylog for Linux Logs)
While you are using the Graylog tool, you will touch on so many benefits and features. A few highlights of Graylog are listed here.
- Solve issues with security, compliance, operational, and DevOps.
- Exploring data
- Real-Time Analysis
- Lower OPS costs
- Empower non-tech users
- Interactive Dashboards
- Alerting and Triggers
- Graphic log analysis
- Simple log UI for administration
- Scalable log collection
- Rest API
- Scheduled reports
- Teams management
- Friendly GUI and supports
- Authentication and user permissions
- Powerful search syntax
- Easy connecting with Python applications
Graylog Disadvantages
You may face some cons while using Graylog. Let’s see what are those. Since Graylog can nit read from Syslog files, you must send your messages to Graylog directly. Reports say that it is not friendly enough on the dashboard front and reporting functionally was poor and not satisfying.
Linux logs management using Graylog
To set up Graylog on Linux, you need to consider some prerequisites. You must prepare Elasticsearch 6.8 and higher, MongoDB 3.6 and above, and Oracle Java SE 8 (Or OpenJDK 8). Java should be installed. Running the OpenJDK is totally fine and should be available on all platforms. So, follow the below path to learn the Manual Setup of Graylog on Linux.
Step 1:
First, you should download the tar archive and extract it on your system.
tar xvfz graylog-VERSION.tgzcd graylog-VERSIONStep 2:
Copy the following example configuration file:
cp graylog.conf.example /etc/graylog/server/server.confStep 3:
So, you can start the server as follows:
cd bin/./graylogctl startIn this way, the server tries to write a node_id to the graylog-server-node-if file. The server will not start if it can not write there because of for example missing permissions.
Step 4:
Then, you must view a line in the debug output Graylog successfully connected to your Elasticsearch cluster. It could be as below:
2013-10-01 12:13:22,382 DEBUG: org.elasticsearch.transport.netty - [graylog-server] connected to node [[Unuscione, Angelo][thN_gIBkQDm2ab7k-2Zaaw][inet[/10.37.160.227:9300]]]The logs of Graylog are located on logs/.
Note: Since all systems running Graylog must have synchronized system time, try to use NTP or a similar mechanism on all machines of your Graylog infrastructure.
Conclusion
In this article, you reviewed Introducing Graylog for Linux Logs Management. To meet your operations, security, and compliance needs, Graylog will ingest many terabytes of log messages every day and process and store them. As a good log management tool, Graylog has an efficient and comprehensive event log collection and storage. To send another type of log as per your need, you can customize Graylog.


