Linux Server Monitoring Commands, This article examines 20 Linux Application Commands and Command-Line to monitor the performance of Linux services.
Table of Contents
Linux VPS Server Monitoring Commands
Debugging and troubleshooting Linux systems is very difficult for most system administrators or network administrators using Linux commands.
As a Linux system administrator, it is very difficult to maintain a Linux server because of the command-line environment. For this reason, here are some of the useful commands that are useful for Linux-based systems. These commands are applicable to a variety of Linux distributions and are very useful for troubleshooting and monitoring Linux servers.
Top command – Monitor Linux processes
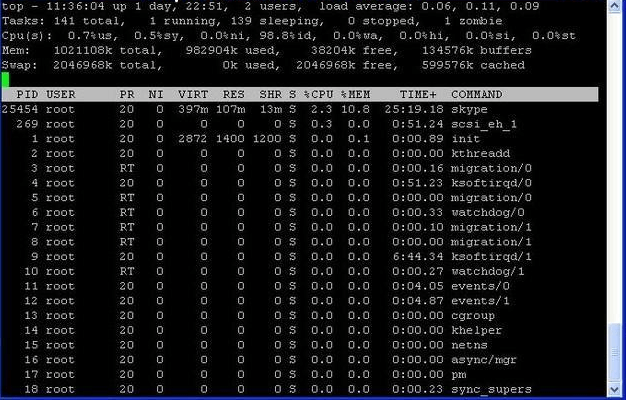
The top command is very useful for monitoring the performance of Linux/UNIX systems. Many server administrators use this command. In fact, the top command in Linux displays a regular list of all Real-Time processes and processes that are active or running. This list is regularly updated.
With the Top command, you can see CPU usage, memory usage, Swap Memory, Cache size, Processor buffer size, PID, users, commands, and so on. This command also allows you to view the processes that have the highest amount of memory or CPU usage.
For example, in the image below you can see the output of the Top command.
vmstat – The amount of virtual memory consumed
To display the number of Virtual Memory Statistics, kernel threads, disks, system processes, interrupts, CPU activity, (I/O Blocks) and I/O blocks are used.
By default, vmstat does not exist on Linux systems and you need to install a package called sysstat to enable it. The following is the most common vmstat command:

lsof – Displays the list of open files
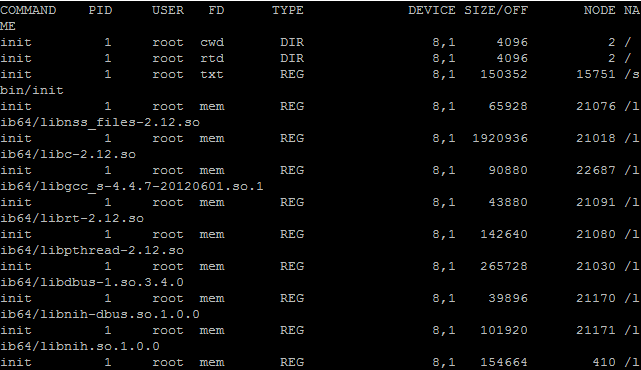
Another utility in Linux/Unix-based systems is the lsof command. The lsof statement is used to display a list of all files and open processes. Open files include all disk files, network sockets, Processes, Devices, and Pipes. The most important use of this command is when the drive cannot be un-mount when mount/unmount. And it comes with an error like “File is open or in use“. As a result, you can use this command to determine which files are currently open.
tcpdump – Network packet analysis
Tcpdump is one of the most commonly used Linux commands. This command can be used as a network packet analyzer or packets sniffer program. It is also possible to store specific packages in files for future analysis. The tcpdump command is applicable to most different Linux distributions.

netstat – Network usage
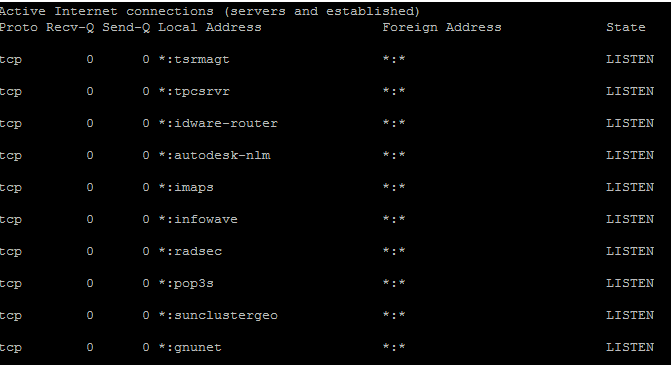
netstat is an application instruction to monitor the incoming and outgoing values of network packets. This command is helpful in monitoring network performance and resolving possible problems with the server administrator.
htop – Monitoring Linux Processes
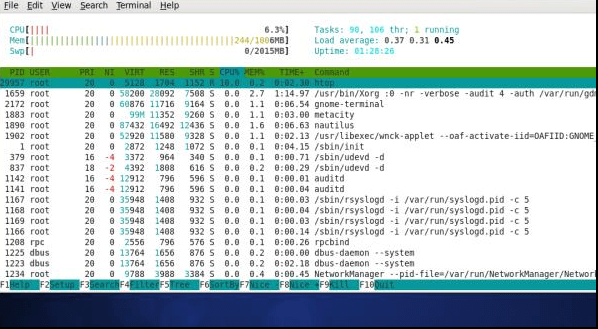
The htop command is a very powerful and Real-Time command for instant monitoring of Linux processes. This command is similar to the Top command. However, other functionalities such as vertical or horizontal view of processes, shortcuts, provide a user-friendly interface for managing processes.
The htop command is a third-party tool and is not by default on Linux systems. To install the htop command, you must use the YUM management packs.
iotop – Monitoring I/O Disks
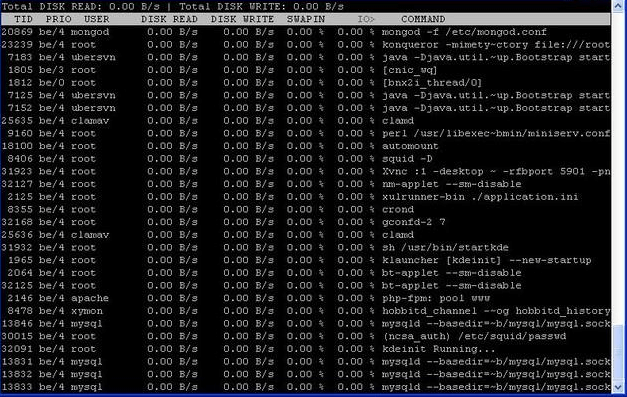
This is very similar to the Top command and the htop program. However, the iotop command uses computational functions to monitor and display I/O disk and instantaneous processes.
This command is most often used to find exactly the Read/Writes processes that take up a lot of disk space.
iostat – Input/Output Usage
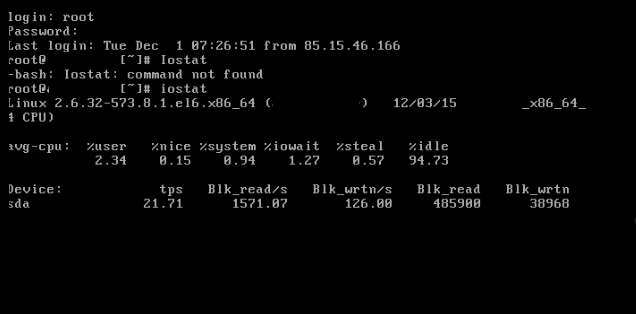
ioStat is a simple command to collect and display I/O storage devices. This command is often used to check the performance of storage devices. Applying this command can troubleshoot problems with local disks, I/O devices, and remote disks such as NFS.
iptraf – Lan IP network instant monitoring
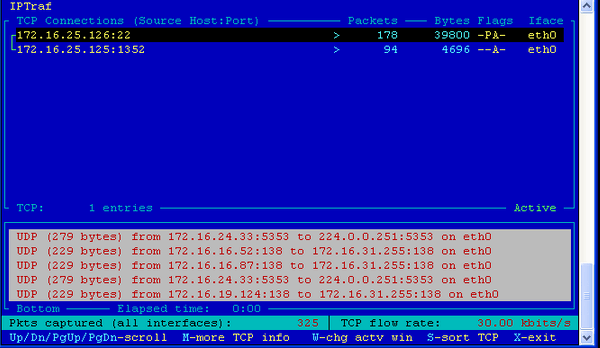
The iptraf command is an Open Source and console-based command for real-time monitoring of the LAN IP (Real-Time IP LAN Monitoring). It monitors and displays a variety of information such as IP traffic to the network, including TCP flag, ICMP, TCP/UDP weaknesses, TCP packets, and the number of bytes.
It also provides useful and accurate information on TCP, UDP, IP, ICMP, non-IP consumption, IP checksum errors, interface activity and more.
psacct or acct – Monitoring User Activities
This command provides a very useful tool to monitor all the activities of users running in the background, as well as to scrutinize all activities at a glance. It also specifies which users are using which resources.
These commands are very useful for server administrators. This command allows you to check the activities of users such as what actions they are currently performing on the server, what commands they execute, how much each of them consumes, how long they are active on the system.
Linux Server Monitoring Commands;
monit – Monitoring Linux services and processes
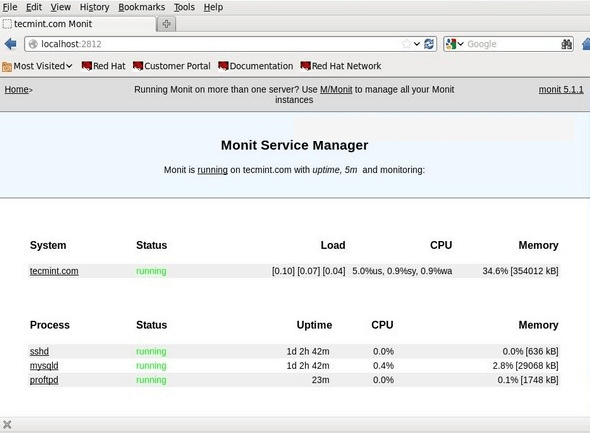
monit is an open-source command and is a process monitoring tool. It automatically monitors management system processes, programs, files, folders, access permissions, system files, and checksum.
The monit command monitors all services such as Apache, MySQL, Mail, FTP, ProFTP, Nginx, SSH and so on.
The result of the system status is visible both in the command line and in the graphical interface.
nethogs – Monitoring network bandwidth per process
The nethogs command is also a small Open Source command such as the top command. This command is used to display network activity of each process on your system. It also provides real-time network traffic bandwidth used by any application.
iftop – Network Bandwidth Monitoring
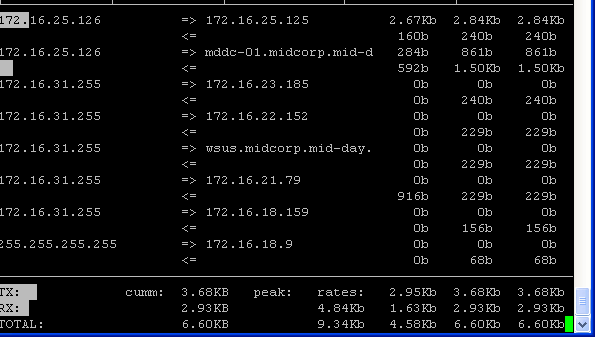
The iftop command is Open Source and terminal-based. This command is used to display a list of bandwidth consumed by your host or destination host on your system network card. Note that the iftop command is used to check network bandwidth. The top command is used to check CPU usage.
The iftop command is from the top command family, which monitors a specific interface and displays the bandwidth consumed between the two hosts.
Linux Server Monitoring Commands;
monitorix – System and Network Monitoring
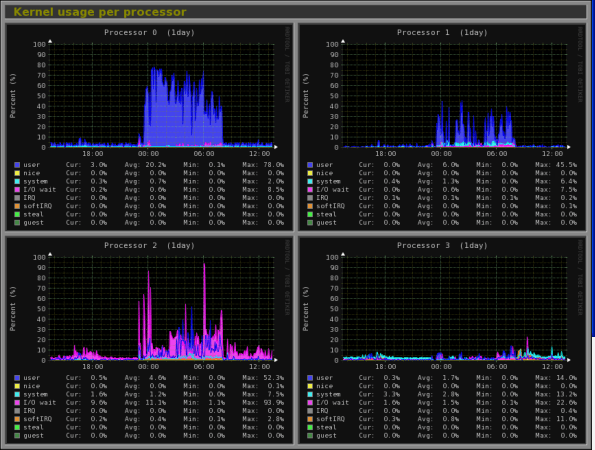
Monitorix is a very lightweight tool on both Linux and UNIX servers designed for monitoring network and system resources. This command contains a specific Http web server that regularly collects network and system information and displays it as graphs or graphs.
Monitorix command monitors system load average, system memory allocation, drivers health, system services, network ports, email usage (Sendmail, Postfix, Dovecot, etc.) and MySQL database usage. In fact, this command is designed to monitor system performance in general. It also enables the detection of bottleneck and any abnormal activity in general.
arpwatch – Monitoring Ethernet activities
The arpwatch command is one of the tools used to monitor the addresses (MAC and IP address changes) of Ethernet traffic on Linux networks. This tool regularly monitors Ethernet traffic. It also generates a report of all the IPs and MAC addresses that change over a period of time on the network. Whenever any changes to these addresses occur, it can send a notification email to the network administrator. This command is very useful for detecting ARP spoofing on the network.
Suricata – Network Security Monitoring
The Suricata command is to secure the network and identify intruders and prevent monitoring of Linux, Windows and FreeBSD systems. This command was designed by the OISF (Open Information Security Foundation).
vnstat PHP – Network Bandwidth Monitoring
Vnstat PHP is a web-based application commonly known as vnstat. This command graphically monitors and displays network traffic usage. The vnstat PHP command displays the amount of inbound and outbound traffic consumed per hour, either daily, monthly, or overall consumption reports.
Nagios – Network/Server Monitoring
Using the Nagios system, network administrators will be able to manage Linux, Windows, Switches, Routers, printers on a single page. This command sends an alert to the network administrator via email if any problems with the network or server are suspected.
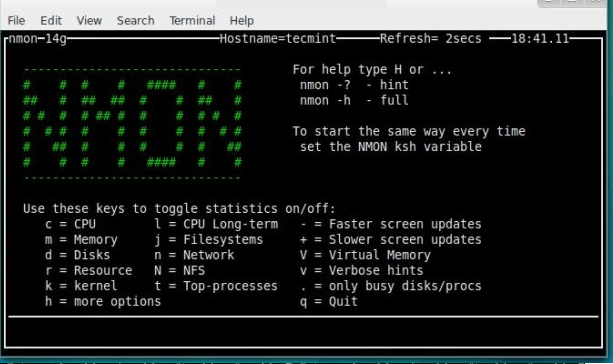
nmo – Linux Performance Monitoring
The nmon command stands for Nigel’s performance Monitor. This command is used to monitor Linux resources such as CPU, Memory, Disk Usage, Network, Top processes, NFS, Kernel and more. It also has both Online Mode and Capture Mode to store outputs in CSV format.
collectl – Multipurpose monitoring tool
The collectl tool is a very powerful and comprehensive tool that can collect complete information from Linux service sources such as CPU usage, memory, network, inodes, processes, NFS, TCP, sockets and so on.


