Innotop is an advanced command line-based research application for monitoring local servers and MySQL output under the InnoDB engine. Innotop includes many features and different types of modes/options. These features help users avoid various aspects of MySQL output performance to find out what is wrong with the MySQL server. In this article, we try to introduce you to the Tutorial Install Innotop to Monitor MySQL on CentOS. You can visit the packages available in Eldernode to purchase a CentOS VPS server.
Table of Contents
How to Install Innotop to Monitor MySQL on CentOS 7 | 8
Install Innotop to Monitor MySQL on CentOS
As the Innotop package is not included with CentOS by default now, you will need to install it by activating the Epel third-party repository. To do this you can use the following command:
yum install innotopIn the next step to start Innotop, you have to type “innotop” as in the following command. In the following command line, the -u and -p options are the username and password, respectively.
innotop -u root -p 'eldernode'When you can successfully connect to the MySQL server, you will see the following information:
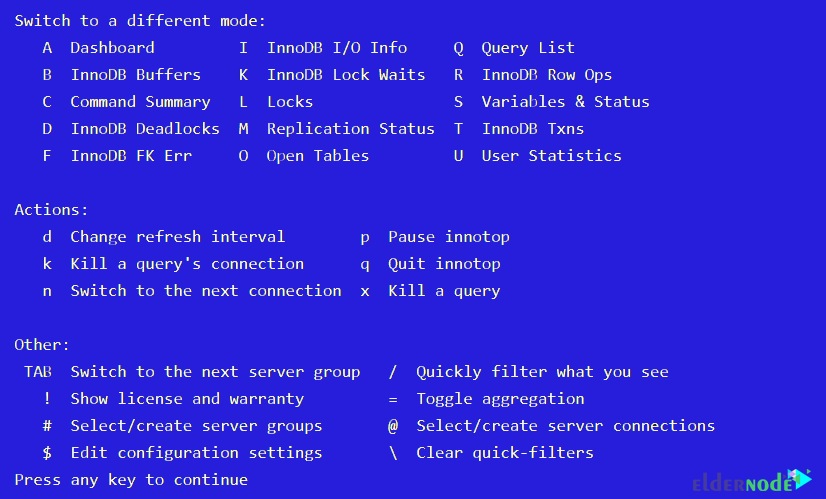
[RO] Dashboard (? for help) localhost, 61d, 254.70 QPS, 5/2/200 con/run/cac thds, 5.1.61-log Uptime MaxSQL ReplLag Cxns Lock QPS QPS Run Run Tbls Repl SQL 61d 4 0 254.70 _ _ 462 Off 1It should be note that if you want to know the features available in Innotop, you can easily run “?“. By doing this, you will see information as below.
The next section is User Statistics. This section shows user statistics and indexes that are sorte by read.
CXN When Load QPS Slow QCacheHit KCacheHit BpsIn BpsOut localhost Total 0.00 1.07k 697 0.00% 98.17% 476.83k 242.83kThe next mode is Query List. Note that this mode shows the output of the SHOW FULL PROCESSLIST.
When Load Cxns QPS Slow Se/In/Up/De% QCacheHit KCacheHit BpsIn BpsOut Now 0.05 1 0.20 0 0/200/450/100 0.00% 100.00% 882.54 803.24 Total 0.00 151 0.00 0 31/231470/813290/188205 0.00% 99.97% 1.40k 0.22 Cmd ID State User Host DB Time Query Connect 25 Has read all relay system u 05:26:04The next section is about InnoDB I/O Info. It should be note that this mode displays InnoDB’s I/O statistics, pending I/O, I/O threads, file I/O and log statistics tables by default.
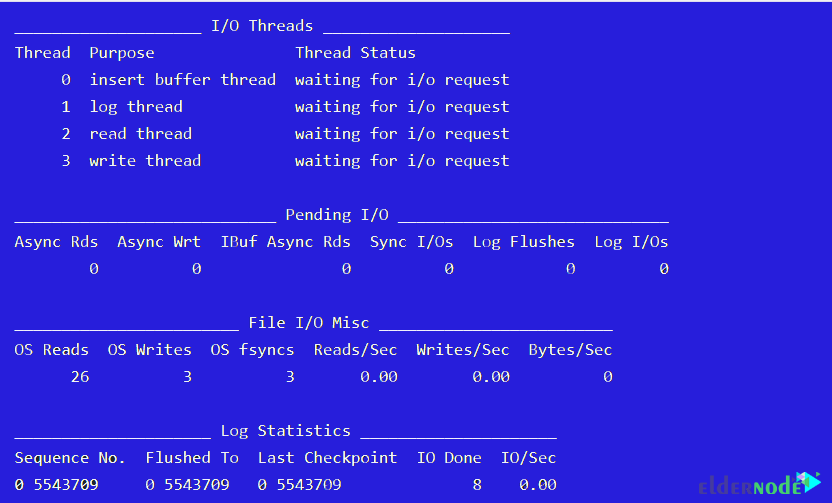
The next part that needs to be said is InnoDB Buffers. In this section, you can view information about the InnoDB buffer pool, page statistics, buffer import, and adaptive hash index.
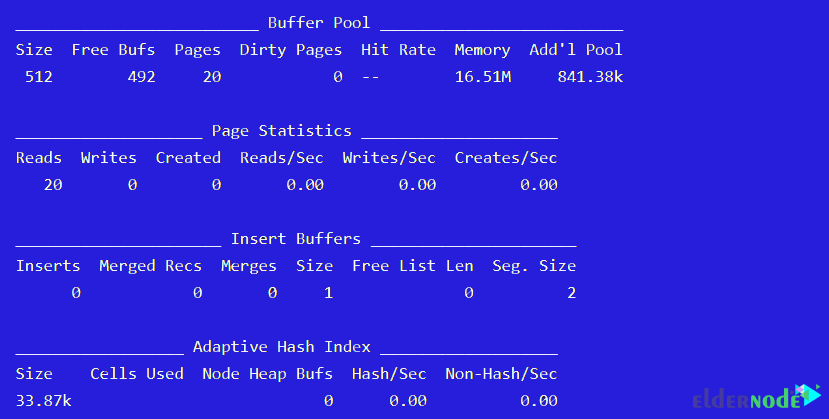
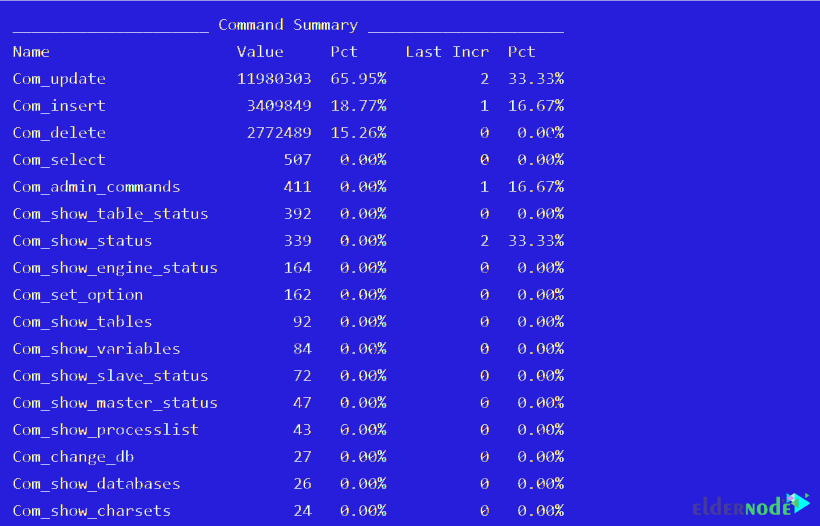
In the next section, called InnoDB Row Ops, you will see the output of InnoDB row operations, row malfunctions, semaphores, and array tables by default.
________________ InnoDB Row Operations _________________ Ins Upd Read Del Ins/Sec Upd/Sec Read/Sec Del/Sec 0 0 0 0 0.00 0.00 0.00 0.00 ________________________ Row Operation Misc _________________________ Queries Queued Queries Inside Rd Views Main Thread State 0 0 1 waiting for server activity _____________________________ InnoDB Semaphores _____________________________ Waits Spins Rounds RW Waits RW Spins Sh Waits Sh Spins Signals ResCnt 2 0 41 1 1 2 4 5 5 ____________________________ InnoDB Wait Array _____________________________ Thread Time File Line Type Readers Lck Var Waiters Waiting? Ending?As you can see in the image below, the command summary mode shows the entire cmd_summary table.
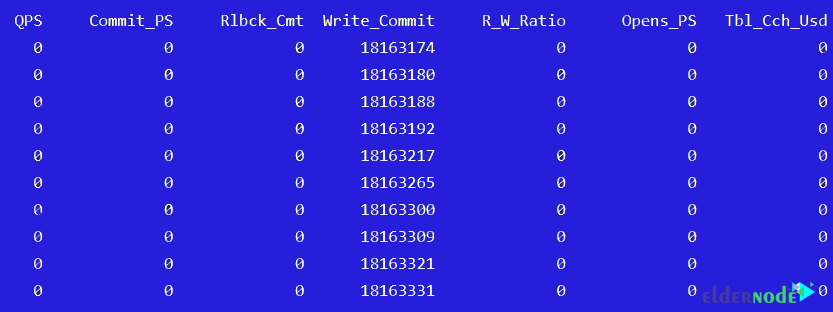
The next section is callingg Variables and Status. In this section, like queries per second, statistics are calculating and displaying in a number of different modes.
Learn how to Setup Innotop to Monitor MySQL on CentOS
Note that another important part is the Replication Status. In this case, you can see the output of Slave SQL Status, Slave I/O Status and Master Status. The first two sections show slave status and I/O slave status, and the last section shows Master status.
_______________________ Slave SQL Status _______________________ Master On? TimeLag Catchup Temp Relay Pos Last Error 178.16.24.115 Yes 00:00 0.00 0 41295853 _______________________ Slave I/O Status _______________________ Master On? File Relay Size Pos State 178.16.24.115 Yes mysql-bin.000025 39.38M 41295708 Waiting for master to send event ____________ Master Status _____________ File Position Binlog Cache mysql-bin.000010 10887846 0.00%The next section is calling Non-Interactively. You can run “Innotop” non-interactively using the following command.
innotop --count 5 -d 1 -nThe final part is Monitor Remote Database, which you can do using the following command and a username, password and hostname.
innotop -u username -p password -h hostnameConclusion
Innotop is a very easy and useful tool that can provide many details of MySQL work. In this article, we tried to learn you how to Install Innotop to Monitor MySQL on CentOS. We have also described the various features and features of Innotop for you.