Percona Monitoring and Management is a free, open-source database. It is used as a system monitoring tool for MySQL, PostgreSQL, MongoDB, and ProxySQL, and the servers they run on. Using PMM helps you to improve the performance of database instances, simplify their management, and strengthen their security. As a popular monitoring solution, it is also known as an efficient, quick-to-set up, and easy-to-use system monitoring tool. This article presents Introducing PMM for Monitoring MySQL / MariaDB. You can find your considered VPS if you visit the available packages of Eldernode.
Table of Contents
Introducing PMM(Percona Monitoring and Management) For Monitoring MySQL
PMM works on the client/server principle and is a client/server application built by Percona with its own and third-party open-source tools. since PMM employs a client/server model, you must download and install both the client and server applications. In case you have just one MySQL or MongoDB server, you can install and run both server and clients on one database host. While you are using this tool, you will approach the below abilities:
– Visualize a wide range of out-of-the-box system performance metrics
– Collect and analyze data across complex multi-vendor system topologies
– Drill-down and discover the cause of inefficiencies
– Anticipate performance issues, troubleshoot existing ones
– Watch for potential security issues and remedy them
PMM SERVER
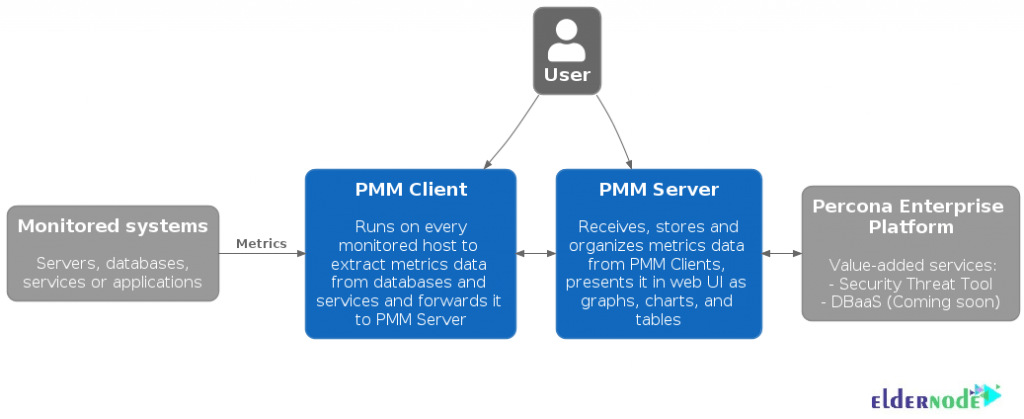
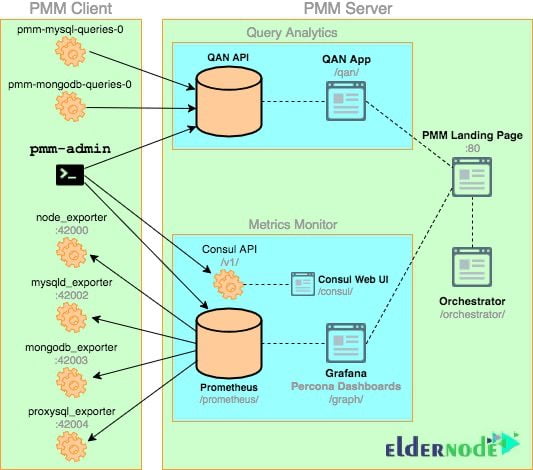
PMM Server receives data from clients, collected and stores it, and acts as the heart of PMM. You can see that the metrics are drawn as tables, charts, and graphs within dashboards, each a part of the web-based user interface. The PMM Server package provides pmm-managed, Query Analytics, Grafana, and VictoriaMetrics.
PMM CLIENT
When you need to monitor any database host or node, you can use PMM client. It will collect server metrics, general system metrics, and query analytics data, and send it to the server. The PMM Client package provides exporters for different database and system types, and administration tools and agents.
PMM Architecture
PMM is based on a client-server model that facilitates scalability. Here is the PMM architecture and detail.
PMM Features (PMM For Monitoring MySQL / MariaDB)
PMM is able to monitor External Services for situations where PMM Client can’t be installed. Review some titles of its features. some of them are added recently in 2020.
1- Query Search
2- Crosshair in Query Analytics
3- System Information
4- New Security Threat Tool
5- Labeling
6- Query Analytics (QAN)
7- New Filter Panel for QAN
8- Easily Remove Services or Nodes From the PMM Inventory Dashboard
PMM Advantages
Here are five of the most important benefits of PMM:
1- Always Open source
2- Performance and speed
3- Hybrid and cloud support
4- Navigate multi-database
5- Easy and fast
PMM Disadvantages
After reviewing the advantages of PMM in the previous section, we now want to address 3 of the most important disadvantages of PMM:
1- Too much Grafana
2- Fail to get an ssh connection
3- Difficult documentation
PMM For Monitoring MySQL / MariaDB
You read about PMM the best open-source database monitoring solution. To reduce complexity, optimize database performance, and improve the security of your business-critical database environment you can use Percona Monitoring and Management. It will do the recent points without considering the location or deployment of them. PMM will also monitor and provide actionable performance data for MySQL variants, including Percona Server for MySQL, Percona XtraDB Cluster, Oracle MySQL Community Edition, Oracle MySQL Enterprise Edition, and MariaDB. PMM has a specialized dashboard for specific engine details and the metrics and data are captured by PMM.
Here, you can see the required privileges to monitor a MySQL instance
GRANT SELECT, PROCESS, SUPER, REPLICATION CLIENT, RELOAD ON *.* TO 'pmm'@'localhost';How To Monitor MySQL / MariaDB Using PMM
Since MySQL database software is a critical part of most enterprise application strategies, you may need to optimize your web applications, database server with free and open-source Percona software. You will have better performance and concurrency for even the most demanding workload with the Percona Distribution. Let’s go through the steps of this section to review how PMM monitors MySQL. The below path works also for PostgreSQL.
Step 1:
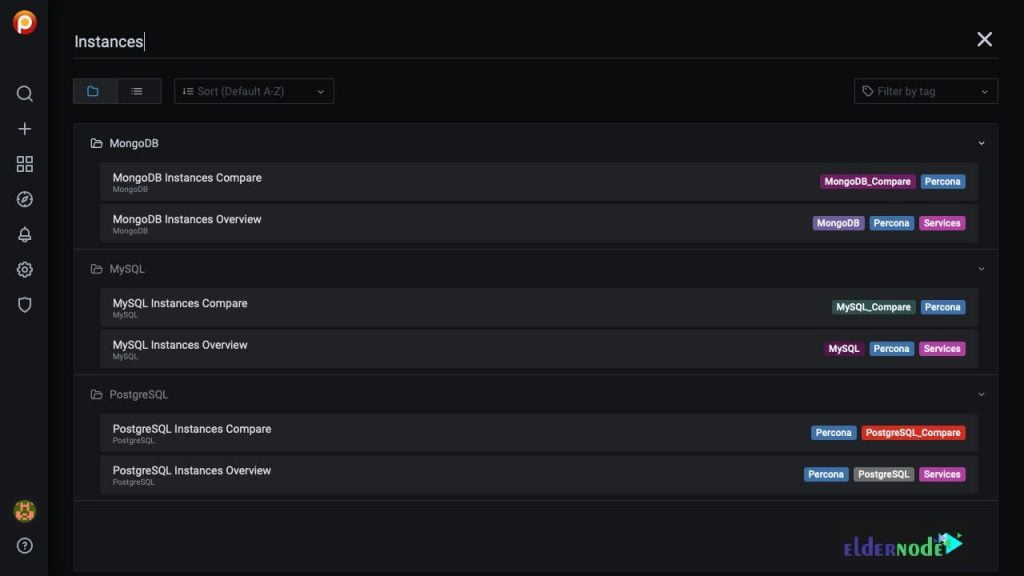
Go to the search button on the left-side menu and search for Add instance.
Step 2:
Click on the PMM Add Instance icon and choose the DB type you wish to monitor. For a remote MySQL database, choose the Adding a Remote MySQL Instance option. Finally, add the DB credentials.
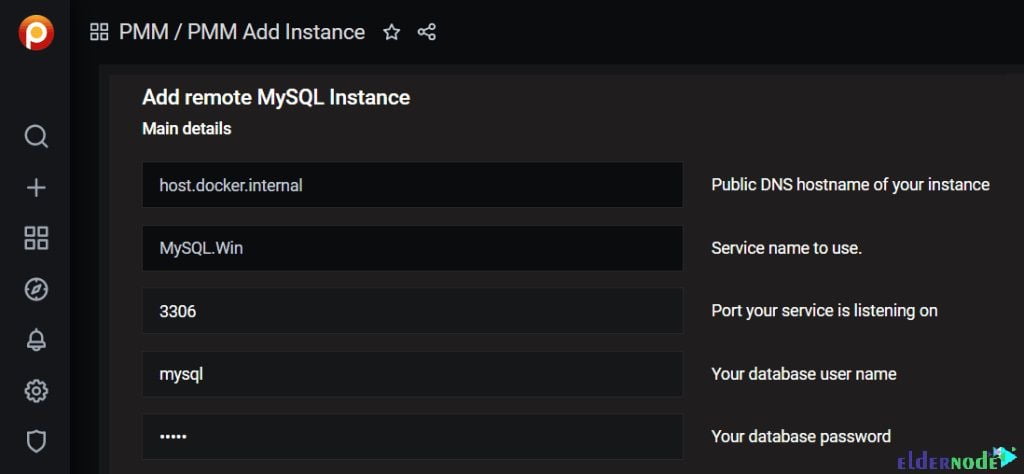
Once you add the database you are interested in monitoring, you can inspect the queries that are executed and see which ones take the longest or are executed the most per second.
Conclusion
In this article, you reviewed Introducing PMM For Monitoring MySQL / MariaDB. You can use its dashboard to get an overview of your MySQL / MariaDB instances in Percona Monitoring and management. Using PMM helps you to have a very complete view of everything that happens, allowing you to select the time interval you want to study and select the database you want to see individually, improving the user experience.
