Many server administrators need a tool to monitor the total bandwidth downloaded or uploaded to the server. The server administrator may use a control panel such as DirectAdmin, cPanel, Plesk, WebSitePanel, or Kloxo to better manage the server, depending on the server operating system. In this article, we are going to teach you How to Monitor Network Traffic with vnStat on Centos 7. It should note that you can visit the packages available in Eldernode to purchase a CentOS VPS server.
Table of Contents
Tutorial Monitor Network Traffic with vnStat on CentOS 7
Traffic monitoring of a VPS server is one of the important things to check the performance of the server. You can use the vnStat tool to do this. Follow us in this article to teach you How to Monitor Network Traffic with vnStat on CentOS 7.
vnStat Features:
In this section, we will introduce 14 vnStat features:
1- Statistics remain available even after system reboots
2- Monitor multiple network interfaces at the same time
3- Multiple output options
4- Sort the data by hour, day, month, week or get the top 10 days
5- Generate png graphic of the output
6- Configure “Months” to follow up with different billing cycles you may have
7- Very light – consumes a really small portion of your system resources
8- Low CPU usage no matter how much traffic you generate
9- You don’t have to be root to use it
10- Select units dynamically (KB, MB, etc)
11- You can add a legend to generated output image
12- Customizable options for content positioning and image background color to vnStat.cgi.
13- The interface bandwidth will be automatically detected.
14- Use JSON for output
How to Install vnStat on CentOS 7 | Centos 8
Once you are familiar with the features of vnStat, in this step we want to teach you how to install vnStat on CentOS 7. After installing vnStat, in the next step, we will teach you how to Monitor Network Traffic with this tool. Please join us. The first step in installing vnStat is to enable the EPEL repositories package. Then you need to execute the following commands in order:
yum -y install vnstatsystemctl start vnstatsystemctl enable vnstatchkconfig vnstat onservice vnstat statusThe important point is that if after installing the program you notice that the program is not updated or does not display any output, you should set the permissions as follows:
chown -R vnstat:vnstat /var/lib/vnstatHow to Configure vnStat on CentOS 7
In this section, we are going to configure vnStat and then how to create a database. Please join us. The first step is to edit the /etc/vnstat.conf configuration file:
vi /etc/sysconfig/vnstatThe sample output will be as follows:
VNSTAT_OPTIONS="-u -i eth0"Now you need to enter the following command to edit /etc/vnstat.conf:
vi /etc/vnstat.confSet the default interface to eth1 as in the following command:
Interface "eth1"Now save the configuration file and exit it.
To create a database, you must first set the vnStat shell to /bin/bash using the chsh command. Then create a database using the following commands:
chsh -s /bin/bash vnstatgrep --color vnstat /etc/passwdid vnstatNote that this is usually the first command used after a new installation. You can use the runuser command to create a database for the eth0 interface:
runuser -l vnstat -g vnstat -c '/usr/bin/vnstat -u -i eth0'You can also run the following command to create a database for the eth1 interface:
runuser -l vnstat -g vnstat -c '/usr/bin/vnstat -u -i eth1'Use the following commands to ensure that the vnStat user cannot log in:
chsh -s /sbin/nologin vnstatgrep --color vnstat /etc/passwdid vnstatHow to Monitor Network Traffic with vnStat on CentOS Linux
To start the vnStat service at boot time, type the following command:
chkconfig vnstat onYou can also run the following commands to start/stop/restart and control the vnStart service, respectively:
sudo systemctl start vnstatsudo systemctl stop vnstatsudo systemctl restart vnstatsudo systemctl status vnstatHow to view the statistics will be as follows. The syntax is:
vnstatYou can see an example output in the image below:
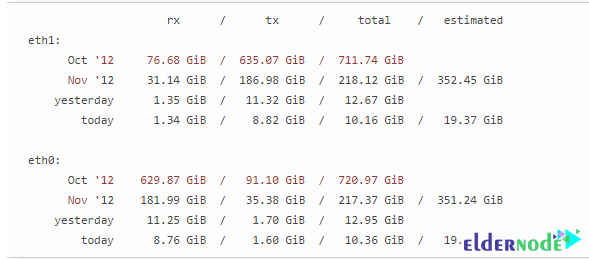
You can enter the following command to view eth0 statistics:
vnstat -i eth0Note that to see the daily stats for eth0, you can enter the following command:
vnstat -i eth0 -dYou can also enter the following command to see the hourly statistics:
vnstat -i eth0 -hTo see the monthly statistics, run the following command:
vnstat -i eth0 -mFinally, to see the weekly statistics, run the following command:
vnstat -i eth0 -wNote that you can use the following command to calculate traffic:
vnstat -i eth0 -trThe output of the above command will be as follows:
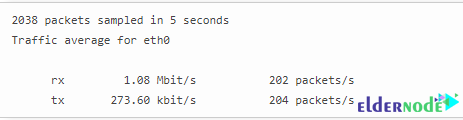
Conclusion
One of the advantages of vnStat is its lightness, which does not impose a special load on the server. This software claims to calculate all the traffic transferred on the service network, whether web server traffic or even the volume of ICMP packets. Consumer traffic will also be visible on an hourly, daily, and monthly basis. In this article, we tried to teach you how to install and monitor Network Traffic with vnStat on CentOS 7.